- Subscribe to RSS Feed
- Mark Topic as New
- Mark Topic as Read
- Float this Topic for Current User
- Bookmark
- Subscribe
- Mute
- Printer Friendly Page
plot multi curves in one window
11-10-2005 06:13 PM
- Mark as New
- Bookmark
- Subscribe
- Mute
- Subscribe to RSS Feed
- Permalink
- Report to a Moderator
11-10-2005 08:18 PM - edited 11-10-2005 08:18 PM
- Mark as New
- Bookmark
- Subscribe
- Mute
- Subscribe to RSS Feed
- Permalink
- Report to a Moderator
A WINDOW is the rectangular thing with a title bar you drag around the screen.
A GRAPH is a LABVIEW indcator with X and Y scales, containing one or more PLOTs.
A PLOT is a set of related data points.
Your example GRAPH has a green PLOT, a brownish-red PLOT and two black PLOTs.
The help for a GRAPH indicator will tell you how to do multi-plot graphs.
It differs a bit depending on whether you want an X-Y graph, or a waveform graph.
There are several different ways, but the most basic graph accepts a bundle { X0, dX, Y[] }
That will plot the Y[] data and make an X-axis starting at X0, and increasing by dX on every point.
If you pass it an array of those bundles, you will get several plots on one graph.
There are other ways too.
Message Edited by CoastalMaineBird on 11-10-2005 08:19 PM
Message Edited by CoastalMaineBird on 11-10-2005 08:20 PM
Culverson Software - Elegant software that is a pleasure to use.
Culverson.com
Blog for (mostly LabVIEW) programmers: Tips And Tricks
11-12-2005 03:44 PM - edited 11-12-2005 03:44 PM
- Mark as New
- Bookmark
- Subscribe
- Mute
- Subscribe to RSS Feed
- Permalink
- Report to a Moderator
Hi Jane,
CoastanMaineBird is right about the difference between a "plot", a
"Graph" and a "window".
It seems that what you want is a either a Graph or a Chart with multiple plots.
It's quite simple to do either of these. As said before, refer to the Context
Help (Ctrl + H) from the block diagram terminal of the Chart or Graph to see
how to add multiple plots. Here's a screenshot of how you would do it with a
Chart and a Graph:
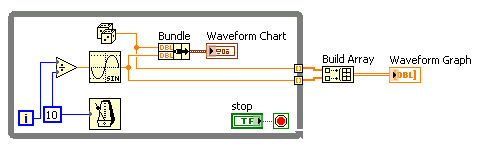
If you want to use different Y-scales for each plot, you need to create multiple
Y-scales and then specify which plot uses which Y-scale:

I hope that this is explanation enough to get you started - otherwise, please
let me know.
Have fun!
Message Edited by Philip C. on 11-12-2005 03:46 PM
11-12-2005 06:16 PM
- Mark as New
- Bookmark
- Subscribe
- Mute
- Subscribe to RSS Feed
- Permalink
- Report to a Moderator
Thank you all! I've tried what you said, it works very well. Thank you so much.
Jane
