- Subscribe to RSS Feed
- Mark Topic as New
- Mark Topic as Read
- Float this Topic for Current User
- Bookmark
- Subscribe
- Mute
- Printer Friendly Page
plotting multiple graphs
04-17-2008 06:51 PM
- Mark as New
- Bookmark
- Subscribe
- Mute
- Subscribe to RSS Feed
- Permalink
- Report to a Moderator
04-17-2008 07:37 PM - edited 04-17-2008 07:39 PM
- Mark as New
- Bookmark
- Subscribe
- Mute
- Subscribe to RSS Feed
- Permalink
- Report to a Moderator
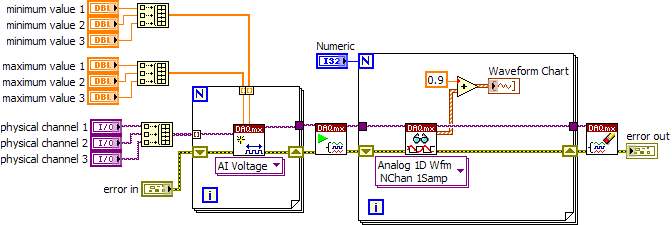
You need to change more that just the way you are plotting the data. You cannot run multiple analog in tasks. You can only have a single task but you can create a single task with multiple channels. Shown below is one way if you want to have separate min/max values for each channel. If you don't, just have a single DAQmx physical channel control with the multiple channels in it. The for loop can then be eliminated. I chose to use to return a 1D wavefrom type from the DAQmx Read NChan 1Samp and then just wire the output to a chart. If you want DBL returned it will be a 1D DBL array but you can't just wire the array to the chart. If you were to turn on Context Help, when you go to the block diagram and move your mouse over the chart indicator, it will show you the correct inputs for different types of charts. There is also a shipping example for charts that you can look at.
Message Edited by Dennis Knutson on 04-17-2008 06:39 PM
04-19-2008 12:24 AM
- Mark as New
- Bookmark
- Subscribe
- Mute
- Subscribe to RSS Feed
- Permalink
- Report to a Moderator
Thanks for your reply and suggestions. Before i implement this , just wanted to ask if this will allow me to view three analog channels on the SAME waveform chart.
04-19-2008 12:37 AM
- Mark as New
- Bookmark
- Subscribe
- Mute
- Subscribe to RSS Feed
- Permalink
- Report to a Moderator
Hi Mia,
yes you see three analog value on the same wavaform chart.
Mike
04-23-2008 07:55 PM
- Mark as New
- Bookmark
- Subscribe
- Mute
- Subscribe to RSS Feed
- Permalink
- Report to a Moderator
Hi Dennis,
I tired reading and plotting the two analog values on the same axes but its working partially. One of the reading as you will see in the attached VI ( graph in green color ) is working fine . But the red color graph is constantly giving ZERO value, however when i measure it using multimeter it say the voltage is 0.5 V.
I have also tried auto scaling of Y and X axes but will need to know what small error am i making. Using your technique is giving TWO graphs instead of one which can overlap both the curves. I am actually looking for a scalable solution which can allow me to overlap as many graphs as possible on the same axes.
I am using labview8.5.... looking forward to your reply.
04-23-2008 10:00 PM
- Mark as New
- Bookmark
- Subscribe
- Mute
- Subscribe to RSS Feed
- Permalink
- Report to a Moderator
04-24-2008 12:00 AM
- Mark as New
- Bookmark
- Subscribe
- Mute
- Subscribe to RSS Feed
- Permalink
- Report to a Moderator
Dennis, I know i am asking silly questions... but it will really help if you can send me a image file or paint file so that i can correlate to your senteces and labview programming.
Thanks
04-24-2008 01:22 AM
- Mark as New
- Bookmark
- Subscribe
- Mute
- Subscribe to RSS Feed
- Permalink
- Report to a Moderator
Hi Miaa,
attached is your vi, with the additional "create Task.vi".
Mike
05-05-2008 07:38 AM
- Mark as New
- Bookmark
- Subscribe
- Mute
- Subscribe to RSS Feed
- Permalink
- Report to a Moderator
05-05-2008 07:45 AM
- Mark as New
- Bookmark
- Subscribe
- Mute
- Subscribe to RSS Feed
- Permalink
- Report to a Moderator
