- Subscribe to RSS Feed
- Mark Topic as New
- Mark Topic as Read
- Float this Topic for Current User
- Bookmark
- Subscribe
- Mute
- Printer Friendly Page
shift registers do not update
06-28-2005 01:07 PM
- Mark as New
- Bookmark
- Subscribe
- Mute
- Subscribe to RSS Feed
- Permalink
- Report to a Moderator
I am trying to use shift register to create two arrays (current and voltage) during a voltage sweep. The two arrays are subsequently bundled to display in XY graph. But I found it can't display the curve in real time. And I found the reason is that the two shift registers outside of the for loop do not update as usually. I am confused with the situation. In this case, the for loop is inside of a sequence structure, inside of another for loop. Please see my attachment for the diagram. Hope to get some help here. Thanks.
06-28-2005 01:16 PM
- Mark as New
- Bookmark
- Subscribe
- Mute
- Subscribe to RSS Feed
- Permalink
- Report to a Moderator
06-28-2005 01:19 PM
- Mark as New
- Bookmark
- Subscribe
- Mute
- Subscribe to RSS Feed
- Permalink
- Report to a Moderator
06-28-2005 01:23 PM - edited 06-28-2005 01:23 PM
- Mark as New
- Bookmark
- Subscribe
- Mute
- Subscribe to RSS Feed
- Permalink
- Report to a Moderator
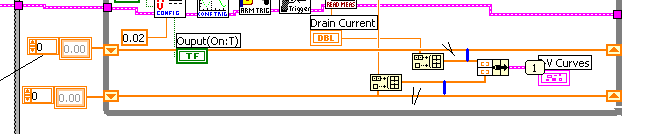
Break the wires at the black lines indicated (||)and connect where indicated with a blue line.
Message Edited by altenbach on 06-28-2005 11:24 AM
06-28-2005 01:59 PM
- Mark as New
- Bookmark
- Subscribe
- Mute
- Subscribe to RSS Feed
- Permalink
- Report to a Moderator
06-28-2005 02:02 PM
- Mark as New
- Bookmark
- Subscribe
- Mute
- Subscribe to RSS Feed
- Permalink
- Report to a Moderator
06-28-2005 02:03 PM
- Mark as New
- Bookmark
- Subscribe
- Mute
- Subscribe to RSS Feed
- Permalink
- Report to a Moderator
Then just paste it into paint, and save it as JPG or PNG, or something other than paint's default of BMP
06-28-2005 02:40 PM - edited 06-28-2005 02:40 PM
- Mark as New
- Bookmark
- Subscribe
- Mute
- Subscribe to RSS Feed
- Permalink
- Report to a Moderator
@Code wrote:
How to display the graph in my message? I can see that by altenbech's post directly. It is a lot more convinience.
-Attach your image to your post;
-Submit your post;
-Go to your post and click on the link to the attachment, then copy the address of the attachment;
-Go back to your post. Select "Edit Message" from the "Options" on the right side immediately above your post.
-Add (img src= http://forums.ni.com/attachments/ni/170/128445/1/new.PNG) replacing ( ) with < > and whatever is the real address for the image.
-Submit your post again.
And your attached image from http://forums.ni.com/attachments/ni/170/128445/1/new.PNG will be inserted comme ca:

Works best with small images like altenbach's or your second one, not your first.
Message Edited by Donald on 06-28-2005 03:41 PM
Fading out. " ... J. Arthur Rank on gong."
06-28-2005 03:38 PM
- Mark as New
- Bookmark
- Subscribe
- Mute
- Subscribe to RSS Feed
- Permalink
- Report to a Moderator
06-28-2005 03:42 PM - edited 06-28-2005 03:42 PM
- Mark as New
- Bookmark
- Subscribe
- Mute
- Subscribe to RSS Feed
- Permalink
- Report to a Moderator
@Code wrote:
... I could not find Edit message from the option menu. Do I need some previlidge or just need to turn on the option from somewhere?
"Edit Message" is only available for a fixed amount of time after you submit a post. I think it's currently set somewhere between 5 and 10 minutes.
Message Edited by Donald on 06-28-2005 04:44 PM
Fading out. " ... J. Arthur Rank on gong."
