- Subscribe to RSS Feed
- Mark Topic as New
- Mark Topic as Read
- Float this Topic for Current User
- Bookmark
- Subscribe
- Mute
- Printer Friendly Page
simple question...Referencing channel outputs to each other?
11-14-2007 11:05 AM
- Mark as New
- Bookmark
- Subscribe
- Mute
- Subscribe to RSS Feed
- Permalink
- Report to a Moderator
Nick
11-14-2007 11:29 AM
- Mark as New
- Bookmark
- Subscribe
- Mute
- Subscribe to RSS Feed
- Permalink
- Report to a Moderator
i.e. read all four voltages, (v1...v4) and then just scale (divide?) the signals by v4 to get your ratio every iteration.
(something like the pic in the attachment?, knocked up very quickly to give you an idea, the VI will not run for obvious reasons)
11-15-2007 02:25 PM
- Mark as New
- Bookmark
- Subscribe
- Mute
- Subscribe to RSS Feed
- Permalink
- Report to a Moderator
Hello Nick,
There is not a way with DAQmx to include another channel in a custom scale. Instead, it will be necessary to perform the data manipulation in LabVIEW. The post that nrp made shows an excellent way to get the ratio of voltages from one channel to another.
Getting Started with NI-DAQmx and Learn 10 Functions in NI-DAQmx and Handle 80 Percent of Your Data Acquisition Applications are great starting points for programming with DAQmx. Have a great day!
Please post back if you have any questions.
Browning G
FlexRIO R&D
11-16-2007 05:45 PM
- Mark as New
- Bookmark
- Subscribe
- Mute
- Subscribe to RSS Feed
- Permalink
- Report to a Moderator
11-19-2007 03:31 PM - edited 11-19-2007 03:31 PM
- Mark as New
- Bookmark
- Subscribe
- Mute
- Subscribe to RSS Feed
- Permalink
- Report to a Moderator
Hello Nick,
Thanks for your reply.
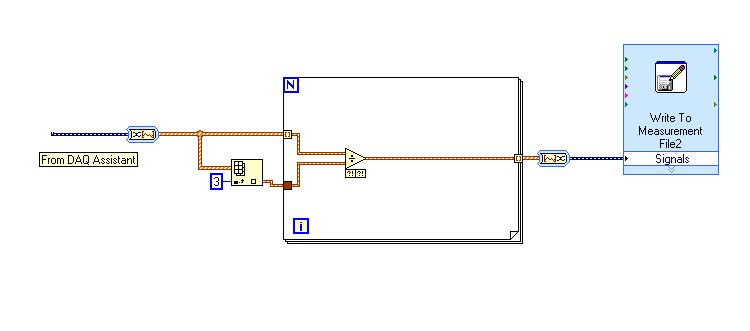
To make one channel per column in a LabVIEW Measurement File, it will be necessary to perform some additional software manipulation. Using the VI image provided by nrp, I added some functionality (shown in the following screen shot) that makes a separate waveform for each channel. This allows for the Write to Measurement File to know how many channels there are. Make sure that when setting up the Write to Measurement File VI that you select to create “one column per channel” in the X Value Columns section.

Message Edited by BrowningG on 11-19-2007 03:31 PM
Browning G
FlexRIO R&D
11-30-2007 02:03 PM
- Mark as New
- Bookmark
- Subscribe
- Mute
- Subscribe to RSS Feed
- Permalink
- Report to a Moderator
12-03-2007 05:29 PM - edited 12-03-2007 05:31 PM
- Mark as New
- Bookmark
- Subscribe
- Mute
- Subscribe to RSS Feed
- Permalink
- Report to a Moderator
Hello Nick,
The issue you are seeing with the graph appears to be related to something earlier in your program. The first Convert from Dynamic Data VI is only returning a 1D array of scalars (the default setting for this VI) where each point in the array is the data from one channel. Because the data has been converted to a 1D array, when you finally graph the data, each channel contains only one point instead of ten points like you expect. If you choose the 1D array of waveforms option, the output from the Convert from Dynamic Data VI will contain all 1000 points for each channel. You will need to modify the signal manipulation part of the VI to reflect these changes. I have modified the image from a previous post that reads multiple samples from multiple channels and saves them to a measurement file.
It is important to note that whenever data is converted from a Dynamic Data Type, the timing information is lost unless the data is converted to an array of waveforms. The image below shows how this can be done.
Message Edited by BrowningG on 12-03-2007 05:31 PM
Browning G
FlexRIO R&D
