- Subscribe to RSS Feed
- Mark Topic as New
- Mark Topic as Read
- Float this Topic for Current User
- Bookmark
- Subscribe
- Mute
- Printer Friendly Page
xy graph with y axis color?
08-05-2018 01:02 PM
- Mark as New
- Bookmark
- Subscribe
- Mute
- Subscribe to RSS Feed
- Permalink
- Report to a Moderator
Is it possible to show the Y axis in an XY graph as a different color depending on its Y values? I have seen this done with 3D Intensity graphs, but need to use the XY Graph. I am displaying spectrum data using and XY graph. It presently looks like this:
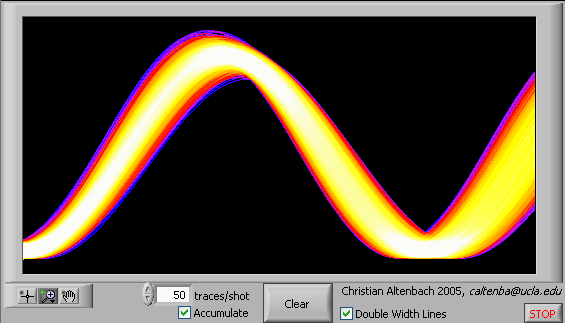
I would like it to look like this (without the starry background):
08-05-2018 01:54 PM
- Mark as New
- Bookmark
- Subscribe
- Mute
- Subscribe to RSS Feed
- Permalink
- Report to a Moderator
Yes, map it into an intensity graph.
08-05-2018 01:56 PM
- Mark as New
- Bookmark
- Subscribe
- Mute
- Subscribe to RSS Feed
- Permalink
- Report to a Moderator
08-05-2018 02:02 PM - edited 08-05-2018 02:03 PM
- Mark as New
- Bookmark
- Subscribe
- Mute
- Subscribe to RSS Feed
- Permalink
- Report to a Moderator
@TeraTech wrote:
Is it possible to show the Y axis in an XY graph as a different color depending on its Y values? I have seen this done with 3D Intensity graphs, but need to use the XY Graph.
Who imposes the restriction that it "needs" to be an xy graph? You should always use the tool most suitable for the job!
If there are relatively few possible colors, you can overlay several plots on an xy graph, each with selective data and corresponding fill color, and each filled to zero. Seems clumsy.
08-05-2018 05:07 PM
- Mark as New
- Bookmark
- Subscribe
- Mute
- Subscribe to RSS Feed
- Permalink
- Report to a Moderator
When I connect my 2D data to an intensity graph it looks like this:
The help for Intensity graph says: the array indices are the X and Y for a given Z. In my case the Z is going to be the same as the Y, right?
08-05-2018 05:19 PM
- Mark as New
- Bookmark
- Subscribe
- Mute
- Subscribe to RSS Feed
- Permalink
- Report to a Moderator
@TeraTech wrote:
When I connect my 2D data to an intensity graph it looks like this:
The help for Intensity graph says: the array indices are the X and Y for a given Z. In my case the Z is going to be the same as the Y, right?
This code makes absolutely no sense. You need to setup a 2D array with all zeroes and a size corresponding to e.g. the number of pixels in the graph in each dimension. Place it in a shift register. Now, in a loop, you would replace certain elements point by point with your data, using x as column index and y as row index and a value scaled to Y. You need to apply the desired linear mapping to relate x and y to array indices and z (based on y) to the color.
