- Subscribe to RSS Feed
- Mark Topic as New
- Mark Topic as Read
- Float this Topic for Current User
- Bookmark
- Subscribe
- Mute
- Printer Friendly Page
how to manululate the output of the DAq Read
03-12-2008 07:14 PM
- Mark as New
- Bookmark
- Subscribe
- Mute
- Subscribe to RSS Feed
- Permalink
- Report to a Moderator
Iam using kusb3116 DAQ for plotting the data on to a graph ...
i have used the LV-Link VI's to collect the data from two channels of the DAQ on to the PC ..but now i need to plot the waveform chart ..for the two voltages ...
My problem is how can i manupulate the data that i have captured from the DAQ before i plot it on th graph, as i need to manupulate one of the voltages ..before actually plotting ..
Thnks,
Shaik.
03-12-2008 09:54 PM
- Mark as New
- Bookmark
- Subscribe
- Mute
- Subscribe to RSS Feed
- Permalink
- Report to a Moderator
03-13-2008 08:54 PM
- Mark as New
- Bookmark
- Subscribe
- Mute
- Subscribe to RSS Feed
- Permalink
- Report to a Moderator
Thanks for the Reply .. i have sloved that issue ..
Currently iam facing an other problem...
As iam invoice labview programmer ..i am using a k3116 DAQ .. using that iam capturing a signal at a sampling rate of 500kSamples/Sec and plotting that on to a waveform chart ..
To be more specific ..iam capturing a square wave ..which has varying amplitudes ..and i want to know how can i calculate the amplitudes(Voltage) when the wave is in ON position and viceversa OFF..
Thanks
Shaik
03-13-2008 11:33 PM
- Mark as New
- Bookmark
- Subscribe
- Mute
- Subscribe to RSS Feed
- Permalink
- Report to a Moderator
03-14-2008 07:11 PM
- Mark as New
- Bookmark
- Subscribe
- Mute
- Subscribe to RSS Feed
- Permalink
- Report to a Moderator
it works Fine ...
May i know how can i calculate the Duty cycle of a square waveform ..that i have captured using the kUSB-3116 DAQ..
Thanks.
03-14-2008 07:51 PM
- Mark as New
- Bookmark
- Subscribe
- Mute
- Subscribe to RSS Feed
- Permalink
- Report to a Moderator
03-14-2008 08:01 PM
- Mark as New
- Bookmark
- Subscribe
- Mute
- Subscribe to RSS Feed
- Permalink
- Report to a Moderator
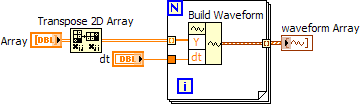
Is there any data type converssion tht i can perform to convert a 2D array of 16 bit floats in to a waveform DBL,...
Thanks
03-15-2008 09:26 AM - edited 03-15-2008 09:26 AM
- Mark as New
- Bookmark
- Subscribe
- Mute
- Subscribe to RSS Feed
- Permalink
- Report to a Moderator
Sure. If your 2D data is arranged so that each column is a channel, then do what's shown below. The Build Waveform function is on the Waveform palette. If you data is arranged so that each row is a channel, don't use the Transpose 2D Array. You are not using an NI DAQ board so I have no idea how it returns data.
Message Edited by Dennis Knutson on 03-15-2008 08:26 AM
03-17-2008 12:19 PM
- Mark as New
- Bookmark
- Subscribe
- Mute
- Subscribe to RSS Feed
- Permalink
- Report to a Moderator
(Data Value contains a two-dimensional array of 64-bit, floating-point values. Each element in the first dimension of the array corresponds to a channel in the task. Each element in the second dimension of the array corresponds to a sample from the channel.)
Hi dennis ..
i dint understand abt the dt input that was shown above... Since iam reading 500Ksamples/Sec .. what should this input be for my case ...
Thanks,
Anwar
03-18-2008 08:29 AM
- Mark as New
- Bookmark
- Subscribe
- Mute
- Subscribe to RSS Feed
- Permalink
- Report to a Moderator
I'm not sure if their exaplanation is much help. You should be able to determine whether the channels is in columns or rows simply by creating an array indicator.
The dt is the inverse of the sample rate. 500Ksample/sec means that the time between samples is 1/500K = 0.000002.
