- Subscribe to RSS Feed
- Mark Topic as New
- Mark Topic as Read
- Float this Topic for Current User
- Bookmark
- Subscribe
- Mute
- Printer Friendly Page
How to measure relative phase of several sine wave inputs
02-05-2008 08:50 AM
- Mark as New
- Bookmark
- Subscribe
- Mute
- Subscribe to RSS Feed
- Permalink
- Report to a Moderator
02-06-2008
11:41 AM
- last edited on
10-24-2025
12:30 PM
by
![]() Content Cleaner
Content Cleaner
- Mark as New
- Bookmark
- Subscribe
- Mute
- Subscribe to RSS Feed
- Permalink
- Report to a Moderator
Hi,
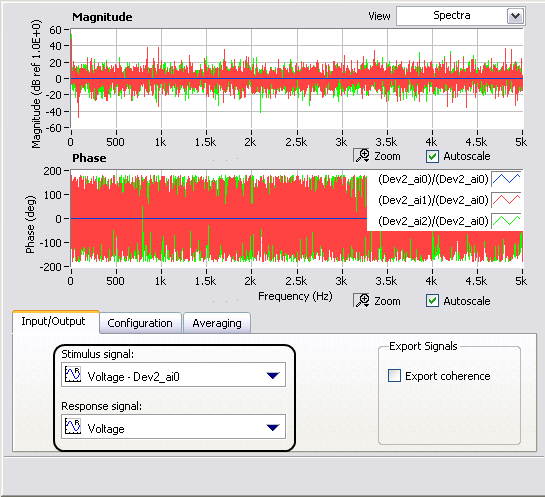
There are some functions you can use to measure the relative phase. You can either measure the phase of every signal related to another one using like you said: a frequency response function step. Using one of these to functions might do the job: “Frequency Response, Express VI” or “Frequency Response Function (Mag-Phase).vi, if you are working in LabVIEW. The first one of these functions "Frequency Response" is also found in signal express and is the one I think you are refering to.
Although this functions is use for a stimulus response approach they will give you the relative phase of Y with respect to X, “Typically, time signal X is the stimulus, and time signal Y is the response of the system. in signal express your options is the frequency response step.
Message Edited by Jaime F on 02-06-2008 11:42 AM
National Instruments
Product Expert
02-06-2008 11:53 AM
- Mark as New
- Bookmark
- Subscribe
- Mute
- Subscribe to RSS Feed
- Permalink
- Report to a Moderator
thanks,
-Scott
02-07-2008 06:32 PM
- Mark as New
- Bookmark
- Subscribe
- Mute
- Subscribe to RSS Feed
- Permalink
- Report to a Moderator
Hi,
You have to options: one is to zoom into the frequency response graph step in Signal Express by changing the limits on the x-axis and approximate the phase at the desired frequency or get LabVIEW where you can manipulate the data retrieved form the function to show only the phase at the desire frequency.
I hope it helps
National Instruments
Product Expert
