- Subscribe to RSS Feed
- Mark Topic as New
- Mark Topic as Read
- Float this Topic for Current User
- Bookmark
- Subscribe
- Mute
- Printer Friendly Page
Sweet Google-ish Graph
04-07-2010 08:57 PM
- Mark as New
- Bookmark
- Subscribe
- Mute
- Subscribe to RSS Feed
- Permalink
- Report to a Moderator
Thanks Jim,
Indeed, I didn't do any optimization on that XControl. Just threw it out in a few minutes of spare time. 
A little more work on the scales would be required, but it takes shape.
04-08-2010
09:34 AM
- last edited on
04-30-2025
04:17 PM
by
![]() Content Cleaner
Content Cleaner
- Mark as New
- Bookmark
- Subscribe
- Mute
- Subscribe to RSS Feed
- Permalink
- Report to a Moderator
Hi Rex,
I will gladly post the code. As a matter of personal pride I'd like to clean it up a bit first, so I'll try to work on it over the weekend. Until then, I'll point out three things about this XControl that differ from the other implementations I've seen on this thread.
- The XControl Data Type is a Dynamic Data Waveform Graph.
- We can embed attributes in the waveform data type. For example, the XControl extracts the "NI_ChannelName" attribute and uses it in the textual legend. If there is no name, the XControl assigns "Unnamed Signal X".
- I find the Merge Signals node intuitive, and the XControl uses Convert From DDT Express VI to un-merge the signals into an array of waveforms.
- The Text Legend is my favorite part. I obtain an array of waveform names, then I use Array to Cluster. With a cluster, I can make the shell and elements transparent, so it looks like a free-floating list of text
 It's also straightforward to get a reference to each cluster control and set the Text.TextColor property to match the Plot.Color property of the waveform on the graph.
I copy-pasted the algorithm for putting a filled circle at each Y-intersect from the presentation that Matt linked to on the 19th.
- The Draw Circle by Radius function takes a Picture input. I start with an empty picture constant into a shift register. Then I run the algorithm from the linked presentation on every waveform by auto-indexing a For Loop. The Picture input comes from the shift register and the output of the draw function outputs to the shift register. That way, we build-up a picture of a few dots instead of one.
I did cheat a little bit because I have a ring of colors that work together on the graph. My coworker is using this library from Google, maybe it's got something for you as well.
04-12-2010 02:13 PM
- Mark as New
- Bookmark
- Subscribe
- Mute
- Subscribe to RSS Feed
- Permalink
- Report to a Moderator
Normandinf, that is truly awesome. I will certainly be using this. I am about to dive into the code to see how it works. Very cool.
[will work for kudos]
04-12-2010 02:16 PM
- Mark as New
- Bookmark
- Subscribe
- Mute
- Subscribe to RSS Feed
- Permalink
- Report to a Moderator
Awesome job normandinf!
04-12-2010 10:12 PM
- Mark as New
- Bookmark
- Subscribe
- Mute
- Subscribe to RSS Feed
- Permalink
- Report to a Moderator
Nice...
05-11-2010 04:09 PM
- Mark as New
- Bookmark
- Subscribe
- Mute
- Subscribe to RSS Feed
- Permalink
- Report to a Moderator
Very Nice graph Norman, thanks for sharing.
Long ago I helped Premise write BioBench for NI. We implemented an expandable horizontal scale very much like the Google graph
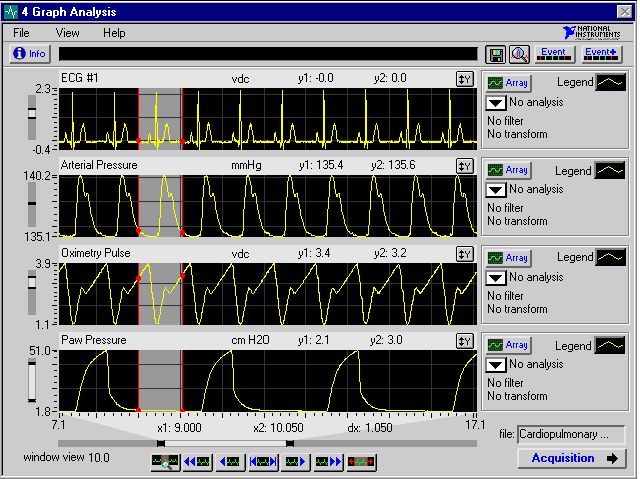
Note the slider along the botton. If you grab the middle, the graph above slides. If you grab either end of slider ticks, then the graph changes scaling. You can achieve the same effect by click-drag in one of the graphs, see the gray area.
Of course this was not done in a nice compact xcontrol. This is multiple layers of transparent graphs & pictures, etc, with lots of code down below doing the decimation. Hmm, I bet it would be easier to do today and refractor into an xnode I mean xcontrol.
-Mike Ashe
06-21-2010 03:35 PM
- Mark as New
- Bookmark
- Subscribe
- Mute
- Subscribe to RSS Feed
- Permalink
- Report to a Moderator
Yes, I remember that graph from BioBench and I always wondered how it was done!
Putting that into an xcontrol would be awesome.
10-26-2010
04:07 PM
- last edited on
04-30-2025
04:18 PM
by
![]() Content Cleaner
Content Cleaner
- Mark as New
- Bookmark
- Subscribe
- Mute
- Subscribe to RSS Feed
- Permalink
- Report to a Moderator
mtat76 wrote:
Rex,
Did you actually take a look at Jonathan's presentation here? I haven't looked at it recently, but I do recall that graph. At the very least, that would give a starting point.
Cheers, Matt
Hey Guys,
I've submitted my code example in the LabVIEW Contest.
https://forums.ni.com/t5/Example-Code/XGrapher-Xcontrol-Waveform-Graph/ta-p/3493496
It's pretty much what you've all been talking about here.
10-27-2010 08:45 AM
- Mark as New
- Bookmark
- Subscribe
- Mute
- Subscribe to RSS Feed
- Permalink
- Report to a Moderator
Your link is broken...I get an Unauthorized Access Message.
10-29-2010 02:13 PM
- Mark as New
- Bookmark
- Subscribe
- Mute
- Subscribe to RSS Feed
- Permalink
- Report to a Moderator
sorry about that, it's fixed now. I've been selected as a finalist, so if you like my code, feel free to vote!
