- Subscribe to RSS Feed
- Mark Topic as New
- Mark Topic as Read
- Float this Topic for Current User
- Bookmark
- Subscribe
- Mute
- Printer Friendly Page
Create waveform from a set of points with differtent time intervals
09-15-2006 05:54 AM
- Mark as New
- Bookmark
- Subscribe
- Mute
- Subscribe to RSS Feed
- Permalink
- Report to a Moderator
09-15-2006 06:24 AM
- Mark as New
- Bookmark
- Subscribe
- Mute
- Subscribe to RSS Feed
- Permalink
- Report to a Moderator
09-15-2006 06:31 AM
- Mark as New
- Bookmark
- Subscribe
- Mute
- Subscribe to RSS Feed
- Permalink
- Report to a Moderator
09-15-2006 06:33 AM
- Mark as New
- Bookmark
- Subscribe
- Mute
- Subscribe to RSS Feed
- Permalink
- Report to a Moderator
Hello,
Yes, this is good. But how can I create with this curve a waveform with a rate of 1Hz for example?
Regards,
Risotto
09-15-2006 07:00 AM
- Mark as New
- Bookmark
- Subscribe
- Mute
- Subscribe to RSS Feed
- Permalink
- Report to a Moderator
sorry Risotto, i misintepreted your query!
i am trying to come up with a possible way.
In meanwhile, let's hope others come up with a good approach
09-15-2006 10:31 AM - edited 09-15-2006 10:31 AM
- Mark as New
- Bookmark
- Subscribe
- Mute
- Subscribe to RSS Feed
- Permalink
- Report to a Moderator
You need to resample your unevenly spaced data.
Try here.
http://sine.ni.com/apps/we/niepd_web_display.display_epd4?p_guid=B45EACE3D93356A4E034080020E74861
Message Edited by unclebump on 09-15-2006 10:35 AM
09-15-2006 11:49 AM - edited 09-15-2006 11:49 AM
- Mark as New
- Bookmark
- Subscribe
- Mute
- Subscribe to RSS Feed
- Permalink
- Report to a Moderator
If you use a Wave From data type, re-sampling is not required.
When using a WF datatype the chart (graph) will pick-up the X value from the t0 of the waveform.
The trick is to just build an array of the single update value and make sure the t0 value is correct.
Re-create this example
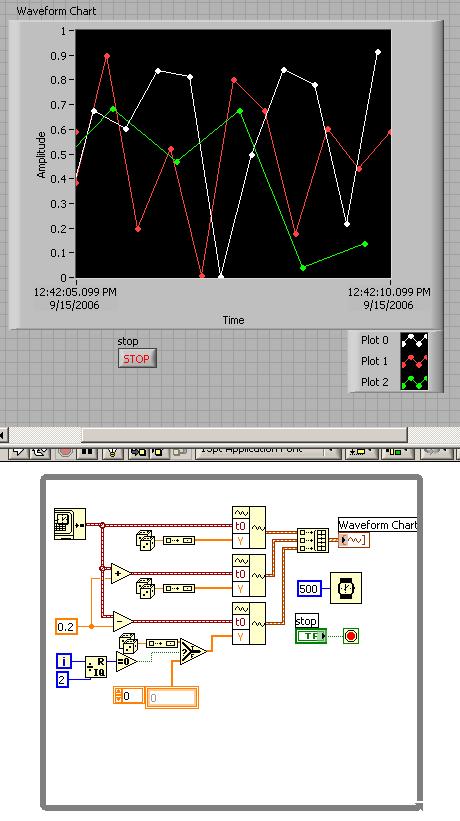
and try it for yourself.
Ben
Note: make sure the data you pass is consistant with the data already displayed. If you post a t0 value that is older than what is already displayed, the chart will clear the display and start over.
Message Edited by Ben on 09-15-2006 11:49 AM
