- Subscribe to RSS Feed
- Mark Topic as New
- Mark Topic as Read
- Float this Topic for Current User
- Bookmark
- Subscribe
- Mute
- Printer Friendly Page
First three harmonic analysis
07-15-2008 01:37 PM
- Mark as New
- Bookmark
- Subscribe
- Mute
- Subscribe to RSS Feed
- Permalink
- Report to a Moderator
Hi Mark
Thank you for your reply. Now I am getting the 330Hz frequency using this code.
I have attached the LabView code. But I am not able to divide the x-scale value
by number of blades i.e 11. I can do this by multiplying the x-scale
value. Is there any other way to do this?
The specific harmonics were seen to be of zigzag type even during no flow condition. Also, the x-axis time scale is not coming as per the real time scale. I am attaching the data for sp. harmonic. Do I need to modify the code?
Thank you
Pramod
07-16-2008 04:57 PM - edited 07-16-2008 05:00 PM
- Mark as New
- Bookmark
- Subscribe
- Mute
- Subscribe to RSS Feed
- Permalink
- Report to a Moderator
Hi Pramod,
To change the timebase for your signal, you can get the waveform component dt, and divide it by the number of blades you are counting. Here is an example of what I'm talking about:
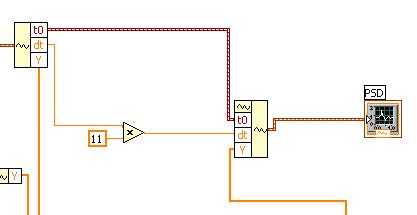
Let me know if this work as expected.
I'm not sure what you mean by "I have attached the code for specific harmonic. In the left most "Build waveform" function, the "dt" value was placed as the inverse of sampling frequency. In the DAQ Assistant there are 6 channels. Will I have to repeatedly write this code for 6 times to get the averaged first three specific harmonic?"
If you want to change the number of harmonics calculated in the average, you can just wire the outputs of those spectral measurments to a different divisor and graph.
Message Edited by Sappster on 07-16-2008 05:00 PM
07-17-2008 01:48 PM
- Mark as New
- Bookmark
- Subscribe
- Mute
- Subscribe to RSS Feed
- Permalink
- Report to a Moderator
I modified the code and it worked well.
About specific harmonic:
As per your suggestions, I had developed the specific harmonic LabView code (available in previous pages of this post). I am acquiring the data with 6 analog channels with 10 kHz sampling frequency and 1000 number of channels. I am having two queries with this code.
1. Will this code work for 6 channels or shall I have to repeatedly write it for 6 times?
2. The x-axis, time, is lagging the real time.
Please see the attached code and the data file.
Thank you
Pramod
07-18-2008 11:09 AM
- Mark as New
- Bookmark
- Subscribe
- Mute
- Subscribe to RSS Feed
- Permalink
- Report to a Moderator
07-22-2008 06:38 AM
- Mark as New
- Bookmark
- Subscribe
- Mute
- Subscribe to RSS Feed
- Permalink
- Report to a Moderator
The time that I am seeing in the measurement file and the graph is same. But that time is not same as the real acquisition time. I have attached the image file. Figure shows that the measurement time is 0.02 seconds however measurement was carried out for more than 5 seconds.
The "dt" parameter in the" build waveform" function (outside the while loop) was selected as 0.0001 based on 10 kHz sampling frequency. Is it correct?
Thank you
Pramod
07-22-2008 10:12 AM
- Mark as New
- Bookmark
- Subscribe
- Mute
- Subscribe to RSS Feed
- Permalink
- Report to a Moderator
07-23-2008 06:42 AM
- Mark as New
- Bookmark
- Subscribe
- Mute
- Subscribe to RSS Feed
- Permalink
- Report to a Moderator
Using trial and error I was just checking the results by varying the "dt" parameter from 0.1 to 0.0001. Today again I checked with 0.0001 sampling time for a 10 kHz sampling frequency, it was showing the data for 0.02 seconds, however it was actually 15 seconds.
I also tried with the method that we used earlier for adding the data after acquisition. I have attached the vi. It is showing only single waveform as we have added the three harmonics.
Thank you
Pramod
07-23-2008 11:29 AM
- Mark as New
- Bookmark
- Subscribe
- Mute
- Subscribe to RSS Feed
- Permalink
- Report to a Moderator
07-25-2008 08:00 AM
- Mark as New
- Bookmark
- Subscribe
- Mute
- Subscribe to RSS Feed
- Permalink
- Report to a Moderator
My ultimate goal is to plot first three harmonics with correct time base. I have used the time interval of 0.0001 seconds for 10 kHz sampling frequency. As you have suggested, the time base in my case will be 10 (sampling frequency/no. of samples). Then shall I have to put 'dt=10' in the "Build Waveform" function placed outside the while loop as shown in my previous attachment?
I am using only DAQ Assistant and not Simulate Signal for the data acquisition. That day I just tried with Simulate Signal as the pc on which I was working was not loaded with NI card. And by mistake I sent that vi attachment.
I couldn't able to open the vi code that you sent as an attachment. The vi code is from higher version and I am using LabView 7.1. Earlier I was having evaluation cd of LabView 9.1 so I managed to open it. However, the evaluation period has expired last week. Therefore can you please send vi code LabView 7.1 version?
07-28-2008 05:54 PM - edited 07-28-2008 05:55 PM
- Mark as New
- Bookmark
- Subscribe
- Mute
- Subscribe to RSS Feed
- Permalink
- Report to a Moderator
Message Edited by Sappster on 07-28-2008 05:55 PM
