- Subscribe to RSS Feed
- Mark Topic as New
- Mark Topic as Read
- Float this Topic for Current User
- Bookmark
- Subscribe
- Mute
- Printer Friendly Page
Is it true that the limit of the graph shown in the report VI is only limited to 0.1?
12-13-2005 02:54 AM
- Mark as New
- Bookmark
- Subscribe
- Mute
- Subscribe to RSS Feed
- Permalink
- Report to a Moderator
12-13-2005 08:29 AM
- Mark as New
- Bookmark
- Subscribe
- Mute
- Subscribe to RSS Feed
- Permalink
- Report to a Moderator
12-13-2005 10:36 PM
- Mark as New
- Bookmark
- Subscribe
- Mute
- Subscribe to RSS Feed
- Permalink
- Report to a Moderator
Hi,
My question is for the output VI that generate report, is it true that the peak to peak of the graph generated is only limited to plus minus 0.1?
Sammmy
12-13-2005 10:52 PM - edited 12-13-2005 10:52 PM
- Mark as New
- Bookmark
- Subscribe
- Mute
- Subscribe to RSS Feed
- Permalink
- Report to a Moderator
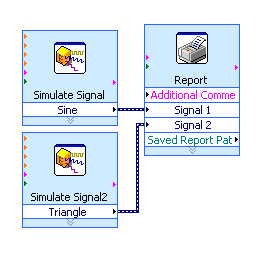
It's still not clear what you are asking about. If you are referring to the "Report" Express VI, it will by default print or save a report with images of a Waveform Graph that is autoscaled to fit the data you provide to the "Signal 1" and "Signal 2" terminals. If you connect a default "Simulate Signal" Express VI, the graph in the report will show the full -1.0 to 1.0 range, since the signal never exceeds this range. Here is my example:
If your report only shows -0.1 to 0.1 it's most likely because your signal does not exceed this range. It is NOT possible to disable the "autoscale" feature from the "Report" Express VI. If you want this type of customization, you need to use the lower level Report Generation VIs in the Report Generation palette.
Message Edited by Philip C. on 12-13-2005 10:52 PM
12-14-2005 11:47 PM
- Mark as New
- Bookmark
- Subscribe
- Mute
- Subscribe to RSS Feed
- Permalink
- Report to a Moderator

12-15-2005 10:01 AM
- Mark as New
- Bookmark
- Subscribe
- Mute
- Subscribe to RSS Feed
- Permalink
- Report to a Moderator
My guess is that you tried to insert an image that resides on your local hard drive. Unless you've got that folder available to everyone on the Internet, that will not work. Use the attachment button below instead.
Anyway, there does a appear to a bug in the Report Express VI for 7.1. I converted it to a regular VI (right click>Open Front Panel). The signal is wired to a subVI called ex_ReportGraphTable. The y scale in this VI has formatting set to 1 significant digit. Even though it is set to autoscale, the 1 significant digit has the same effect as limiting your waveform to +/- .1 range. Change the formatting to 3 significant digits, save the subVI, and your report will look like you want.
This bug has been fixed in 8.0.
12-15-2005 10:26 PM
- Mark as New
- Bookmark
- Subscribe
- Mute
- Subscribe to RSS Feed
- Permalink
- Report to a Moderator
12-18-2005 11:34 PM
- Mark as New
- Bookmark
- Subscribe
- Mute
- Subscribe to RSS Feed
- Permalink
- Report to a Moderator
12-21-2005 01:17 AM
- Mark as New
- Bookmark
- Subscribe
- Mute
- Subscribe to RSS Feed
- Permalink
- Report to a Moderator
Hi Dennis,I have successfully generated the report with the graph being abled to display the y-axis. But now, the table below the waveform cannot reflect the actual values of the x-axis. The table keep displaying 3.21799E+9 for all the x- axis values. The table below is a portion of the report. Sammmy
Company |
Wednesday, December 21, 2005 1:53:23 PM |
|---|
By Author
Operator: S8140437B
Comments
Measured Data

| Current (Scaled) | Current | ||
|---|---|---|---|
| 3.217989E+9 | -4.734014E-5 | 3.217989E+9 | -0.001308 |
| 3.217989E+9 | -0.000238 | 3.217989E+9 | -0.000354 |
| 3.217989E+9 | -0.000528 | 3.217989E+9 | 0.000435 |
| 3.217989E+9 | -0.000644 | 3.217989E+9 | 0.001522 |
| 3.217989E+9 | -0.00028 | 3.217989E+9 | 0.00266 |
| 3.217989E+9 | 0.000707 | 3.217989E+9 | 0.003141 |
| 3.217989E+9 | 0.002198 | 3.217989E+9 | 0.003254 |
| 3.217989E+9 | 0.00386 | 3.217989E+9 | 0.003162 |
| 3.217989E+9 | 0.005308 | 3.217989E+9 | 0.002957 |
| 3.217989E+9 | 0.006253 | 3.217989E+9 | 0.002301 |
| 3.217989E+9 | 0.006531 | 3.217989E+9 | 0.001255 |
| 3.217989E+9 | 0.006078 | 3.217989E+9 | 0.000302 |
| 3.217989E+9 | 0.004945 | 3.217989E+9 | -0.000498 |
| 3.217989E+9 | 0.003296 | 3.217989E+9 | -0.001605 |
| 3.217989E+9 | 0.001325 | 3.217989E+9 | -0.002743 |
| 3.217989E+9 | -0.000801 | 3.217989E+9 | -0.003276 |
| 3.217989E+9 | -0.002893 | 3.217989E+9 | -0.003348 |
| 3.217989E+9 | -0.004713 | 3.217989E+9 | -0.003256 |
| 3.217989E+9 | -0.006041 | 3.217989E+9 | -0.003051 |
| 3.217989E+9 | -0.006754 | 3.217989E+9 | -0.002374 |
| 3.217989E+9 | -0.006807 | 3.217989E+9 | -0.001328 |
| 3.217989E+9 | -0.006198 | 3.217989E+9 | -0.000395 |
| 3.217989E+9 | -0.004993 | 3.217989E+9 | 0.000414 |
| 3.217989E+9 | -0.003341 | 3.217989E+9 | 0.001481 |
| 3.217989E+9 | -0.001411 | 3.217989E+9 | 0.002629 |
| 3.217989E+9 | 0.000654 | 3.217989E+9 | 0.003131 |
| 3.217989E+9 | 0.002688 | 3.217989E+9 | 0.003223 |
| 3.217989E+9 | 0.004463 | 3.217989E+9 | 0.003131 |
| 3.217989E+9 |
12-21-2005 02:12 AM
- Mark as New
- Bookmark
- Subscribe
- Mute
- Subscribe to RSS Feed
- Permalink
- Report to a Moderator
That's because you are passing the time as a value to the report. Time is in LabVIEW defined as the number of seconds since midnight January first 1904. If you change the formatting of the cells in the spreadsheet to add more significant digits, you will see that the numbers are not the same. Please submit your VI or otherwise let us know how you are passing the time information to the report. It should be a simple task to change it to something more familiar.
By the way, do you want the report to show the absolute time and date or do you only want the relative time to the beginning of the data collection?
