- Subscribe to RSS Feed
- Mark Topic as New
- Mark Topic as Read
- Float this Topic for Current User
- Bookmark
- Subscribe
- Mute
- Printer Friendly Page
Property node - setting custom time?
12-01-2007 11:12 AM
- Mark as New
- Bookmark
- Subscribe
- Mute
- Subscribe to RSS Feed
- Permalink
- Report to a Moderator
12-01-2007 01:37 PM - edited 12-01-2007 01:37 PM
- Mark as New
- Bookmark
- Subscribe
- Mute
- Subscribe to RSS Feed
- Permalink
- Report to a Moderator
Message Edited by Ben on 12-01-2007 01:37 PM
12-01-2007 01:49 PM
- Mark as New
- Bookmark
- Subscribe
- Mute
- Subscribe to RSS Feed
- Permalink
- Report to a Moderator
hey Ben,
thnx for the excellent work !
about the sampling rate (it will vary from test to test ,sometimes 10 values per second , sometimes 5), should I use the multiplier & offset node properties ? it will also be read as string from a file.
Best Regards
john
12-03-2007 12:06 PM - edited 12-03-2007 12:09 PM
- Mark as New
- Bookmark
- Subscribe
- Mute
- Subscribe to RSS Feed
- Permalink
- Report to a Moderator
hey Ben !
it looked fine but unfortunately itdoesn`t work... The time stamp you give brings out nothing than 00:00:00, can you maybe post vi ?
Here you have functioning vi except time stamp problem.
You know without solving this problem , I will never finish college..
😞
pls help
Message Edited by J.Dred on 12-03-2007 12:09 PM
12-03-2007 12:44 PM
- Mark as New
- Bookmark
- Subscribe
- Mute
- Subscribe to RSS Feed
- Permalink
- Report to a Moderator
... And here's where I keep assorted lengths of wires...
12-03-2007 12:48 PM
- Mark as New
- Bookmark
- Subscribe
- Mute
- Subscribe to RSS Feed
- Permalink
- Report to a Moderator
Hi J.Dred,
To help you finish college let me pass the following hints
1) Watch your code in execution highlighting (the light buld mode) to see what values are being passed to what.
2) Add indicators to wires to see what is in them (while troubleshooting).
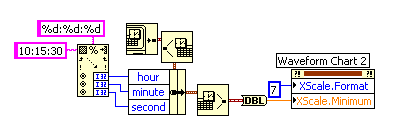
3) There are only 24 hours in a day (hint hint hint)
I used those three facts and managed to get your version working.
Ben
12-03-2007 02:59 PM
- Mark as New
- Bookmark
- Subscribe
- Mute
- Subscribe to RSS Feed
- Permalink
- Report to a Moderator
12-03-2007 03:18 PM - edited 12-03-2007 03:25 PM
- Mark as New
- Bookmark
- Subscribe
- Mute
- Subscribe to RSS Feed
- Permalink
- Report to a Moderator
Message Edited by Ravens Fan on 12-03-2007 04:23 PM
Ben was on it all along. Take a closer look at the difference between your VI and his posted screenshot and the bundle by name functions.
Message Edited by Ravens Fan on 12-03-2007 04:25 PM
12-03-2007 04:05 PM
- Mark as New
- Bookmark
- Subscribe
- Mute
- Subscribe to RSS Feed
- Permalink
- Report to a Moderator
I am using LV 7.1 Student Edition.
this is the last form of my code , I can`t go further, pls tkae a look, I just want the beginning date to be read from string and continue so, 100 ms between the plots which is also read from a string.
could you pls correct it?
best regards
john
12-03-2007 06:19 PM
- Mark as New
- Bookmark
- Subscribe
- Mute
- Subscribe to RSS Feed
- Permalink
- Report to a Moderator
